Creating basic September replicates for capelin
A trawl-acoustic estimate consists of combining acoustic information and information from biological samples taken by trawl. The length distribution is needed in order to calculate the total number of fish and the age distribution is needed for management-relevant models. A method resting on long transects throughout the whole population would not work because there is large scale variation in the length distribution and the transect would have to be divided so that the calculation of number of fish were based on acoustic values being combined with length distribution for the fish backscattering, which in effect would constitute a two-dimensional strata system.
Also, the primary quantity of interest is the biomass of mature capelin. The degree of maturation varies systematically over the distributional area, which again dictates that the estimate cannot be based on first calculating total Sa using transects, then combining with biological data.
Constructing stochastic replicates of Barents Sea capelin is a truly 2-dimensional problem.
Although other approaches might be conceivable, the calculations employed here are based on poststratifying the survey on 2 by 1 degree WMO squares, as is done routinely on the survey.
The measurement of capelin in the Barents Sea has traditionally been based on a strata system where each stratum is a square of one degree latitude and two degrees longitude.
In the present software tool connected to the Bifrost model, various aspects of the trawl-acoustic survey in the Barents Sea are investigated. In some cases results are given below in the present notebook, in other cases results are given as the program runs on the default notebook for messages from Bifrost programs.
The table below shows which information that may be given from the program:
| What | Why | Where |
| Map of WMO squares with trawl positions and trawl numbers | Judging geographical distribution of trawl stations | Present notebook Only if raw data are read |
| Sa values by depth along the course for Norwegian vessels, trawl stations are marked | Judging possible problems connected to small amount of directed trawl stations | Present notebook Only if raw data are read |
| Cumulative distribution of Sa over depth, all Norwegian vessels | Judging possible problems conneced to changing depth between years | Present notebook Only if raw data are read |
| Sa values along the course for Norwegian vessels, divided on pelagic values and bottom channel values | Judging possible problems connected to much capelin near bottom | Present notebook Only if raw data are read |
| Map of WMO squares and survey tracks marked with Sa-values, coloured according to time | Judging to what extent deviation from synopticity is a problem | Present notebook Only if raw data are read |
| Overview of number of transects through squares and number of observations on each track | Judging the extent of the problem with only one track throgh squares | Present notebook |
| For each transect through each square, Sa values and moving average, coloured according to day-night | Judging the effect of changing moving average window | Present notebook |
| A table of mean Sa, samples used and total number of capelin in each square. Comparison to BEAM | Viewing input data | Present notebook |
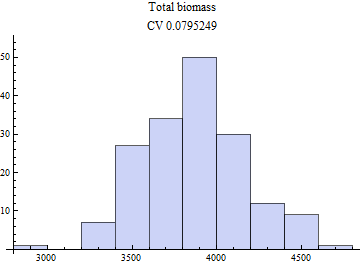
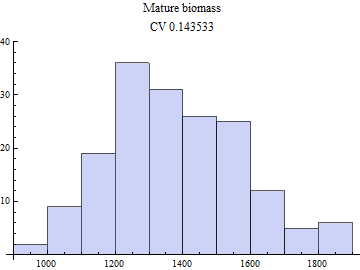
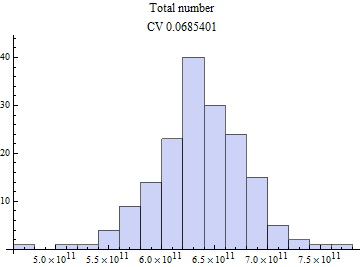
| Abundance estimates in form of tables and histograms | Present notebook | Application notebook |
| Comparisons with various entities used in the BEAM estimate | In-depth comparison with BEAM inputs | Separate notebook |
| A table with detailed information from each biological sample used in the estimate | Viewing input data, and general interest | Present notebook |
| Map showing the geographical structure of mean length of capelin | Judging size of strata | Present notebook |
2013
For the runs presented in the present notebook the following settings have been used:
| Setting name | Value | Effect |
| SeptemberDataOrigin | Intranet | Origin of input data, local computer or IMR intranet |
| MovingAverageWindow | 11 | Size of window for calculating and resampling when moving average is used |
| UseRdataSa | No | For all replicates, the square mean Sa-value used by BEAM is used, for reasons of comparison. |
| ResampleTransects | Yes | If there are two or more transects through a square, they are resampled if ResampleTransects is Yes. If there is only one, the uncertainty is evaluated using nearby squares. |
| UseRdataSamples | Yes | The trawl samples used by BEAM is are used, i.e. the program does not try to allocate stations to the squares. |
| ResampleBetweenSamples | Yes | On Yes, sample numbers are resampled |
| ResampleWithinSamples | Yes | On Yes, sample length distributions resampled |
2013
Table of Sa and sample numbers by square
171 replicates


Finished in BootstrapCapelin
Finished